



Google Ads, Meta Ads, GA4, or a sales system can report the same results in completely different ways. That is a problem, because decisions based on inconsistent or incomplete data can lead to a wrong assessment of the situation, inefficient use of the budget and, as a consequence, financial losses. Where do these discrepancies come from, and what can be done about them? See how to combine data from different sources, draw more accurate conclusions from them, and use AI to answer specific business questions.
Data discrepancies in marketing tools – understand your problem
Discrepancies between tools do not have to mean that one of them reports incorrect data. Each one measures a different scope, applies different rules, and relies on the part of the traffic it can access. Returning to the example from the beginning of the article, I compared the number of purchases reported by Google Ads, Meta Ads, Adform, Google Analytics 4 (GA4), and the sales system of one of our clients. The highest value was 2.4 times higher than the lowest.
Where do such large differences come from? There are several causes.
An event versus an actual purchase
The sales system shows all purchase events for which an order ID was generated. Orders have statuses showing their actual state, for example, paid, unpaid, or cancelled.
GA4 and advertising systems most often record the purchase event before the user moves to the payment gateway or on the thank-you page. The result therefore depends on where the measurement takes place. According to our clients’ data, on average about 30-40% of buyers do not return to the thank-you page, while the number of purchases measured before the order is paid can be even two or three times higher.
Cookie consent
Standard reports in GA4, as well as those in advertising systems, do not show the number of purchases made by users who rejected cookies. The sales system, on the other hand, records every order, regardless of the user’s decision about tracking consent.
It is also worth remembering that consents for individual categories of cookies are separate. A user can, for example, accept analytics cookies while not consenting to advertising ones. The scope of data available in individual systems may therefore differ.
The rule for assigning credit for a conversion
Each advertising system assigns conversions according to its own rules and based on those ad contacts that it is able to recognise. As a result, the same transaction can be assigned to several systems at once, while the contribution of another channel to the same journey may remain invisible.
GA4 assesses the contribution of individual sources according to its own attribution model, while the sales system records the order itself, with no information about which marketing activities contributed to it.
Short-lived cookies and new versus returning customers
The limited storage time of cookies makes it harder for tools to recognise returning users. For example, privacy protection mechanisms in Safari limit the persistence of some data stored on the browser side. As a result, a user who returns to the website after a longer break may be recognised as new, and their earlier purchase activity will not be linked to the next visit.
The scale of the problem is well illustrated by data from one of our clients, concerning users returning after at least eight days. On iOS, 28% of them are counted as two or more users, whereas on Android this share is 0.3%.
What do discrepant data mean for business?
The problem of data discrepancies across marketing tools, and its causes, can be seen across the whole industry. In its report “State of Data 2026”, IAB points out that the fragmentation of the data environment, the loss of signals, and privacy-related changes make it harder today to reliably link media exposure with business results1.
What does this mean in practice? First of all, it is hard to say clearly which activities actually contribute to sales. But the problem does not end with assessing campaign effectiveness. Incomplete data also limit knowledge about customers, their behaviour and purchasing preferences, and thereby make it harder to make decisions about promotions, the offer or product development.
Scattered data therefore become a challenge not only for marketing, but for the whole business. And what if we connected these sources and, instead of browsing each one separately, simply asked the data what we want to know?
Proprietary data integration – get to know our methodology
Simply adding more tools does not solve the problem if the data remain scattered. This is confirmed by McKinsey’s 2025 research: 47% of those responsible for marketing technology decisions point to the complexity of the technology environment and problems with integrating systems and data as barriers to making use of the capabilities of available tools2.
That is why in our approach the starting point is not another tool, but connecting the data. I describe the mechanism at a conceptual level; the full implementation remains our know-how.
1. All of the brand’s data in one place.
Ads, analytics, online sales, in-store tills, CRM and the loyalty programme are all stored in the same place: a data warehouse running in the client’s infrastructure. Each of these sources has its own format, its own update frequency and its own definition of the same event, so simply collecting them side by side solves nothing yet. The value appears only when they start to speak a common language. The data do not leave the client’s environment: the client does not buy access to someone else’s platform, but builds their own asset, which they also use beyond marketing analytics.
2. Our own user identifier
We create our own identifier, which is set on the server side, so it is not subject to the mechanisms that limit the persistence of some cookies set by JavaScript in the browser, e.g., in Safari. We then match it with the available signals coming, among others, from Google and advertising systems.
3. Linking to a specific ad
We pass more information to analytics systems than in a standard setup. Thanks to this, we can assign a click not only to a channel, but also to a specific campaign, ad group, or creative.
Instead of general information such as “paid social, order value”, we get a much more precise answer to the question about the user’s path to purchase.
4. Connecting marketing with sales and customer knowledge
We appropriately secure the information the user leaves on the website and match it with sales data. This makes it possible to link marketing activities not only with a single transaction, but also with the purchase history of a specific customer.
We can enrich the same ecosystem with further sources, e.g., identifiers from loyalty programmes, in-store sales data or information from internet monitoring. This matters because, in the spirit of Anywhere Commerce, a customer does not buy “in e-commerce” or “in a store”: they buy wherever they happen to be, and measurement should follow them, not the channel. For activities that cannot be directly linked to a click, such as influencer posts or in-store campaigns, we can additionally analyse their impact over time.
The result? One customer and a much fuller history of their relationship with the brand. From the first contact with an ad, through behaviour on the website and subsequent purchases, to activity in the loyalty programme.
5. AI – instead of searching reports, we ask the data
Collecting and connecting the data is only the first stage. We integrate the client’s dedicated AI with the warehouse, which you can talk to about the collected data in natural language.
So there is no need to anticipate all business needs at the dashboard design stage. When a new question appears, it can be asked directly, e.g., “Which campaigns most often start the customer journeys with the highest value?” “What products do people acquired during a promotion buy in subsequent orders?” or “How did in-store sales change after a specific campaign was launched?”. As a result, the starting point for analysis becomes the business question, not a set of reports that someone decided to build earlier.
This direction is also visible more broadly in the market. In “State of Data 2026”, IAB points to the growing use of AI in advanced marketing measurement, including attribution, incrementality testing and marketing mix modelling3. In our case, AI additionally lets the user talk to the collected data in their own environment.
Use case – follow real customer journeys.
Below you will see three real purchase journeys of users of one of our clients. Each starts in a different advertising channel and leads through successive brand touchpoints to a purchase.
Journey 1. The role of the traffic source in a purchase
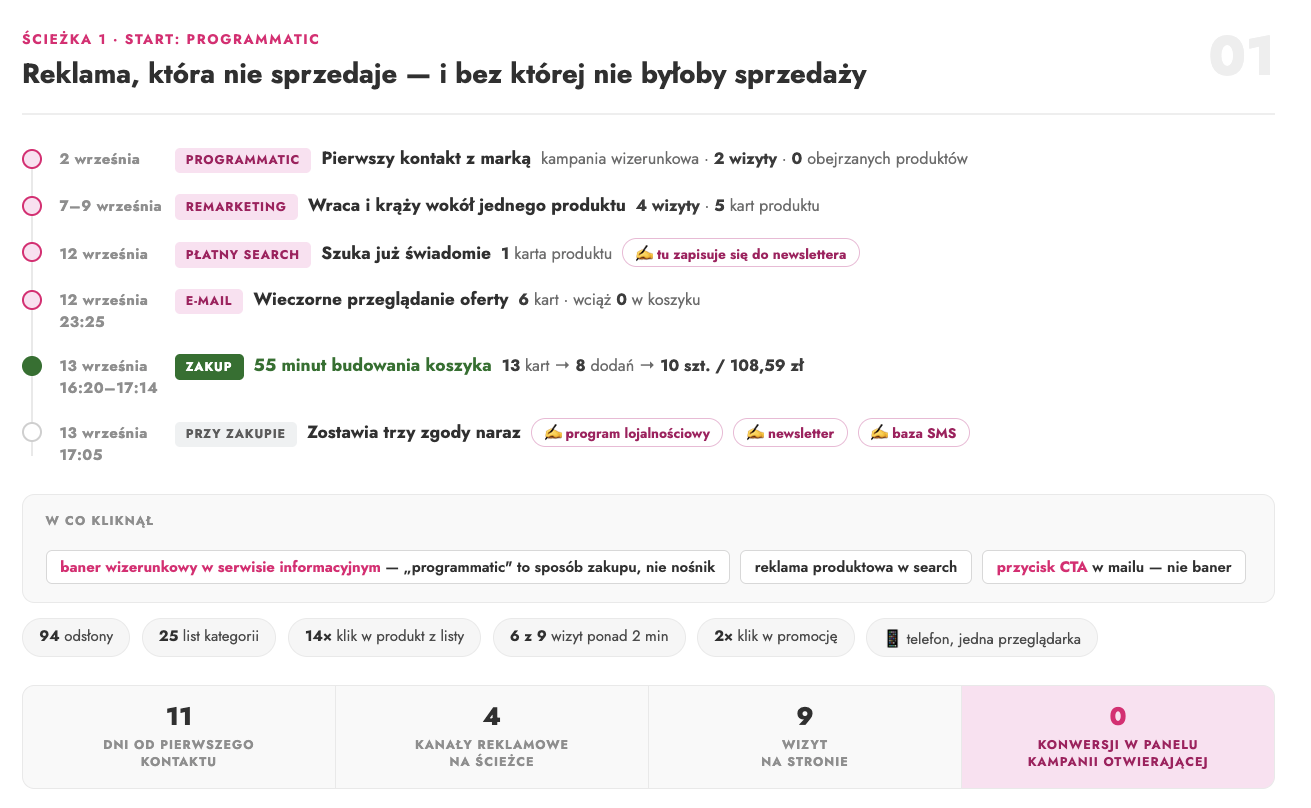
On 2 September, a user visited the website by clicking a brand awareness banner. However, they left the shop after five minutes without looking at any product. Eleven days later, they came back and bought, yet in the panel of the campaign that brought them there, there are still zero conversions.
Each system counts only its own end of the journey: the advertising platform does not see a purchase made eleven days after the visit, while analytics gives the credit to the last click, that is, the email. Both count correctly, and both show zero in the same place. Looking at the campaign report alone, this is spend to cut.
Connected data show that it was precisely this campaign that opened the journey: nine visits, four channels, one purchase. And at the time of purchase, something else happened that is not visible in any report: three marketing consents, for the loyalty programme, the newsletter and SMS. The next contact with this customer will no longer require buying reach.
Journey 2. Data reliability
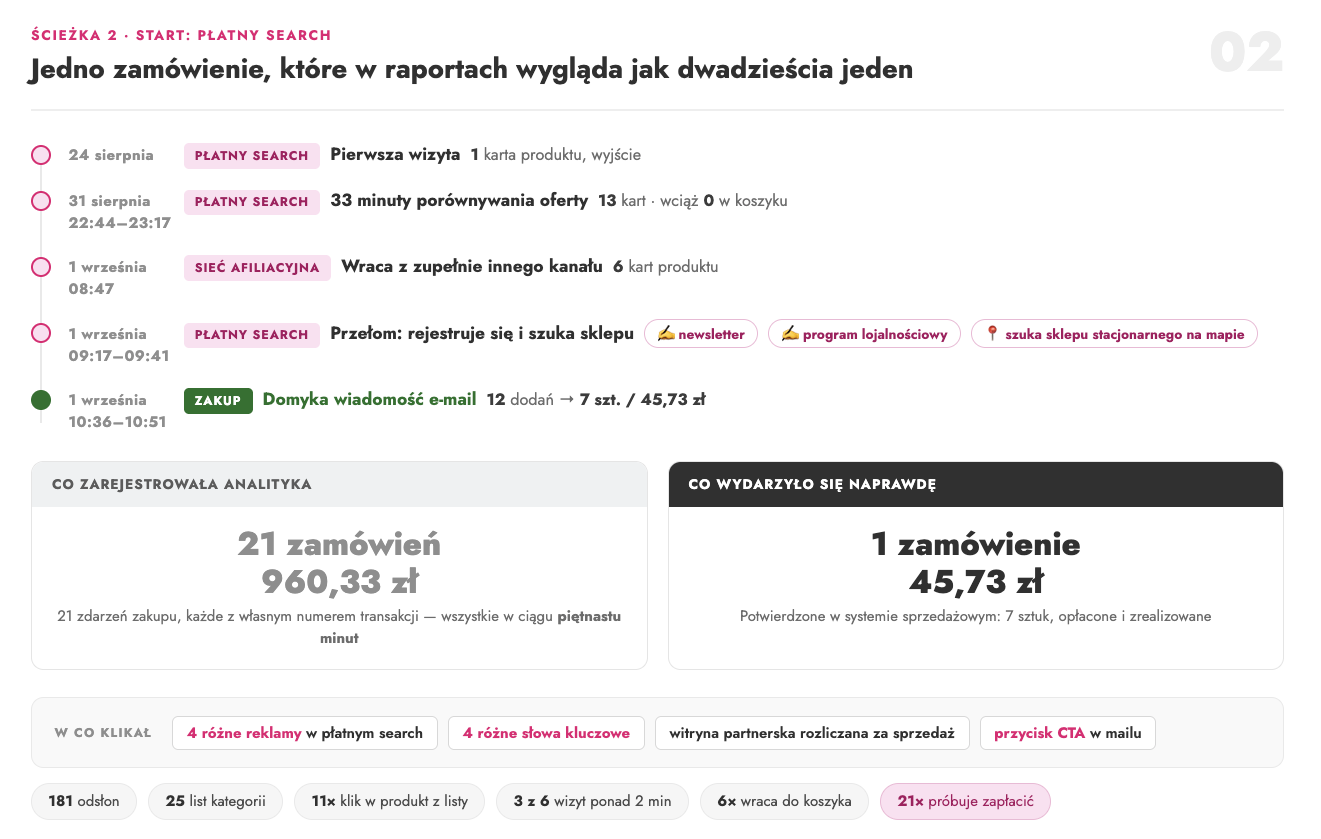
The purchase event fires when the user moves to the payment gateway. This user did it 21 times within fifteen minutes and each time received a new transaction number.
For analytics, this means 21 orders with a total value of PLN 960.33. In reality, there was one transaction for PLN 45.73. A single such journey is therefore enough to significantly inflate reported sales and distort the assessment of marketing effectiveness.
In standard purchase measurement, every counting point has its flaw. An event sent before payment confirmation inflates the result through repeated attempts, while an event sent after it understates it, because some buyers never return to the thank-you page; this user did not reach it either, even though the order was paid. Only comparison with the sales system, in which there is one paid order, makes it possible to settle how many transactions there really were and to correct the numbers on which the assessment of campaigns is based.
Journey 3. Campaign success measured by total customer value
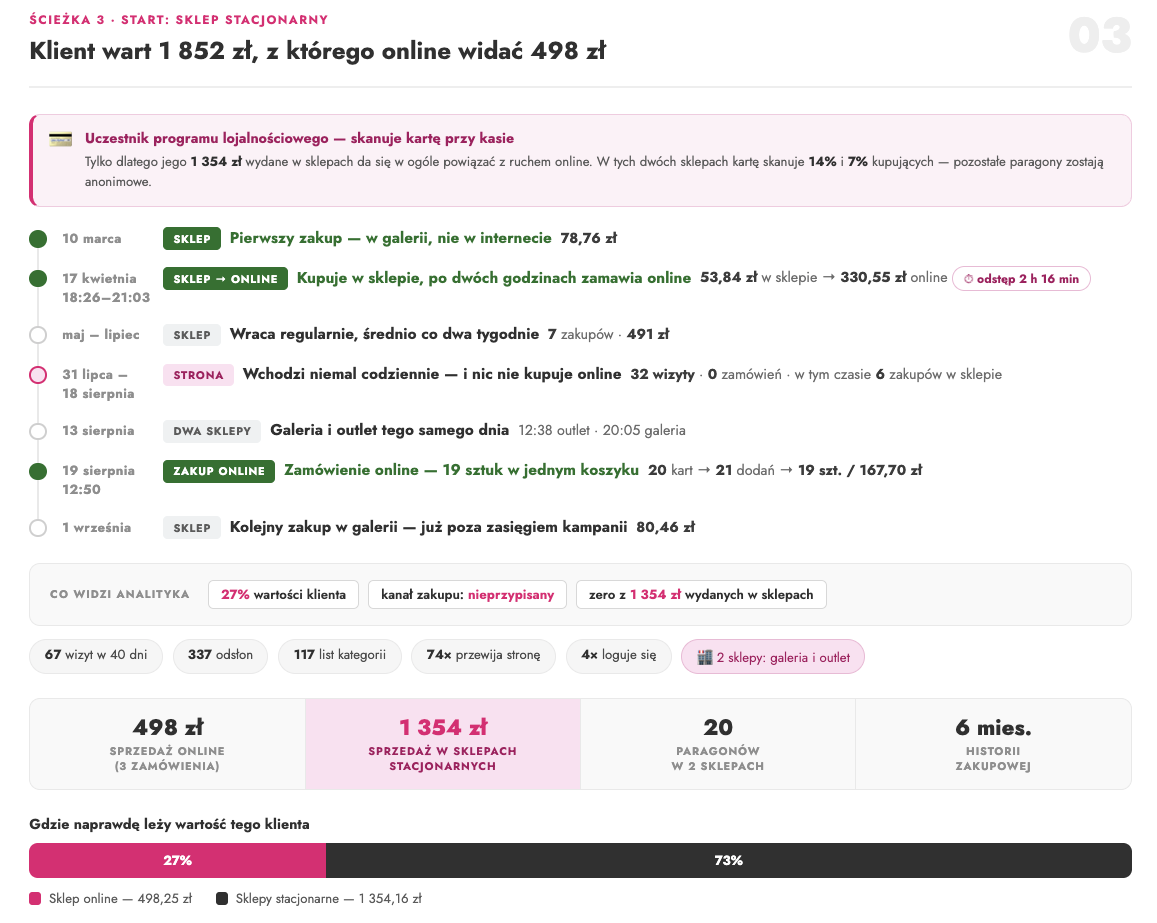
In online sales reports, this customer is worth PLN 498 across three orders, and the last of them, for PLN 168, does not even have a channel assigned. After the data are connected, it turns out that over six months the user spent PLN 1,852, of which PLN 1,354 was in two physical stores: in a shopping mall and in an outlet, 20 receipts in total. Online marketing therefore sees 27% of their real value.
In separate systems, these would be independent events: anonymous traffic on the website, receipts in the mall, and single online orders. Connecting the data makes it possible to see that they are elements of the purchase history of the same person. This is exactly what Anywhere Commerce is about: for the customer, the boundary between online and offline does not exist, so it should not exist in the data on the basis of which we assess their value and the effectiveness of our activities either.
The importance of this perspective is also confirmed by market data on omnichannel retail. In “2025 Retail Industry Outlook”, Deloitte states that customers using multiple channels spend on average 1.5 times more per month than single-channel customers. At the same time, one third of the surveyed retail industry representatives declared significant investments in, among others, building a unified view of the customer across channels4.
AI in analysis – start talking to your data
These three journeys show only a fragment of the possibilities. The real value appears when, in the same way, we look not at individual users but at the entire customer base.
By connecting data from many sources and linking them with an AI environment, we can start from a business question, rather than from choosing a report in which we might find the answer. Which customers are the most valuable and what do they have in common? What do they buy on subsequent visits? Which products acquire new customers and which make them come back? Do people acquired during a promotion stay with the brand after it ends? How do online activities translate into in-store sales?
Dedicated AI makes it possible to ask such questions directly about the client’s data. And when a new hypothesis or business need appears, we are not limited to the set of analyses anticipated when the dashboard was designed.
In this way, the connected data stops serving only a more accurate assessment of campaigns. Different areas of the company can use them to look for answers to current questions and to make decisions in a broader context.
A ready-made tool or your own data layer? – compare the options
Our approach is not the only way to do more advanced analysis of marketing and sales data. The market offers both extensive analytics platforms, such as Northbeam, and much cheaper applications designed for e-commerce. They differ not only in price, but also in the scope of integrations, flexibility, data ownership, and the way they can be used.
Northbeam – broad capabilities, but high cost
Northbeam is a ready-made platform offering, among other things, multi-touch attribution, creative analytics, media mix modelling and incrementality tests. According to the public price list we analysed in August 2026, the Starter and Professional plans cost USD 1,500 and USD 3,500 per month respectively.
The platform operates within a defined ecosystem of integrations. The public list we analysed included about 20 advertising platforms and Klaviyo, but did not include, among others, Adform, CRM, POS or data warehouses.
Cheaper applications – fast, but for a specific type of e-commerce
The alternatives include Reaktion and TrueROAS, whose prices in the price lists we analysed started at about USD 85 and USD 39 per month. These are solutions intended primarily for e-commerce running on Shopify or WooCommerce. They may therefore suit the needs of companies without offline sales, a CRM, or more non-standard data sources.
Our approach – a solution built around the company’s data
In our case, the starting point is the sources the organisation actually uses, from advertising and analytics systems to online and offline sales, CRM and the loyalty programme. Ready-made platforms assume that sales happen in an online shop. We assume that they happen everywhere, and this Anywhere Commerce assumption determines which data must find their way into the warehouse. The data go to a warehouse on the client’s side, and the solution can be extended with further sources.
We also integrate the client’s dedicated AI with the warehouse. The user can talk to it about the collected data and ask their own questions in natural language, even when no dashboard or report has been prepared for a given topic beforehand.
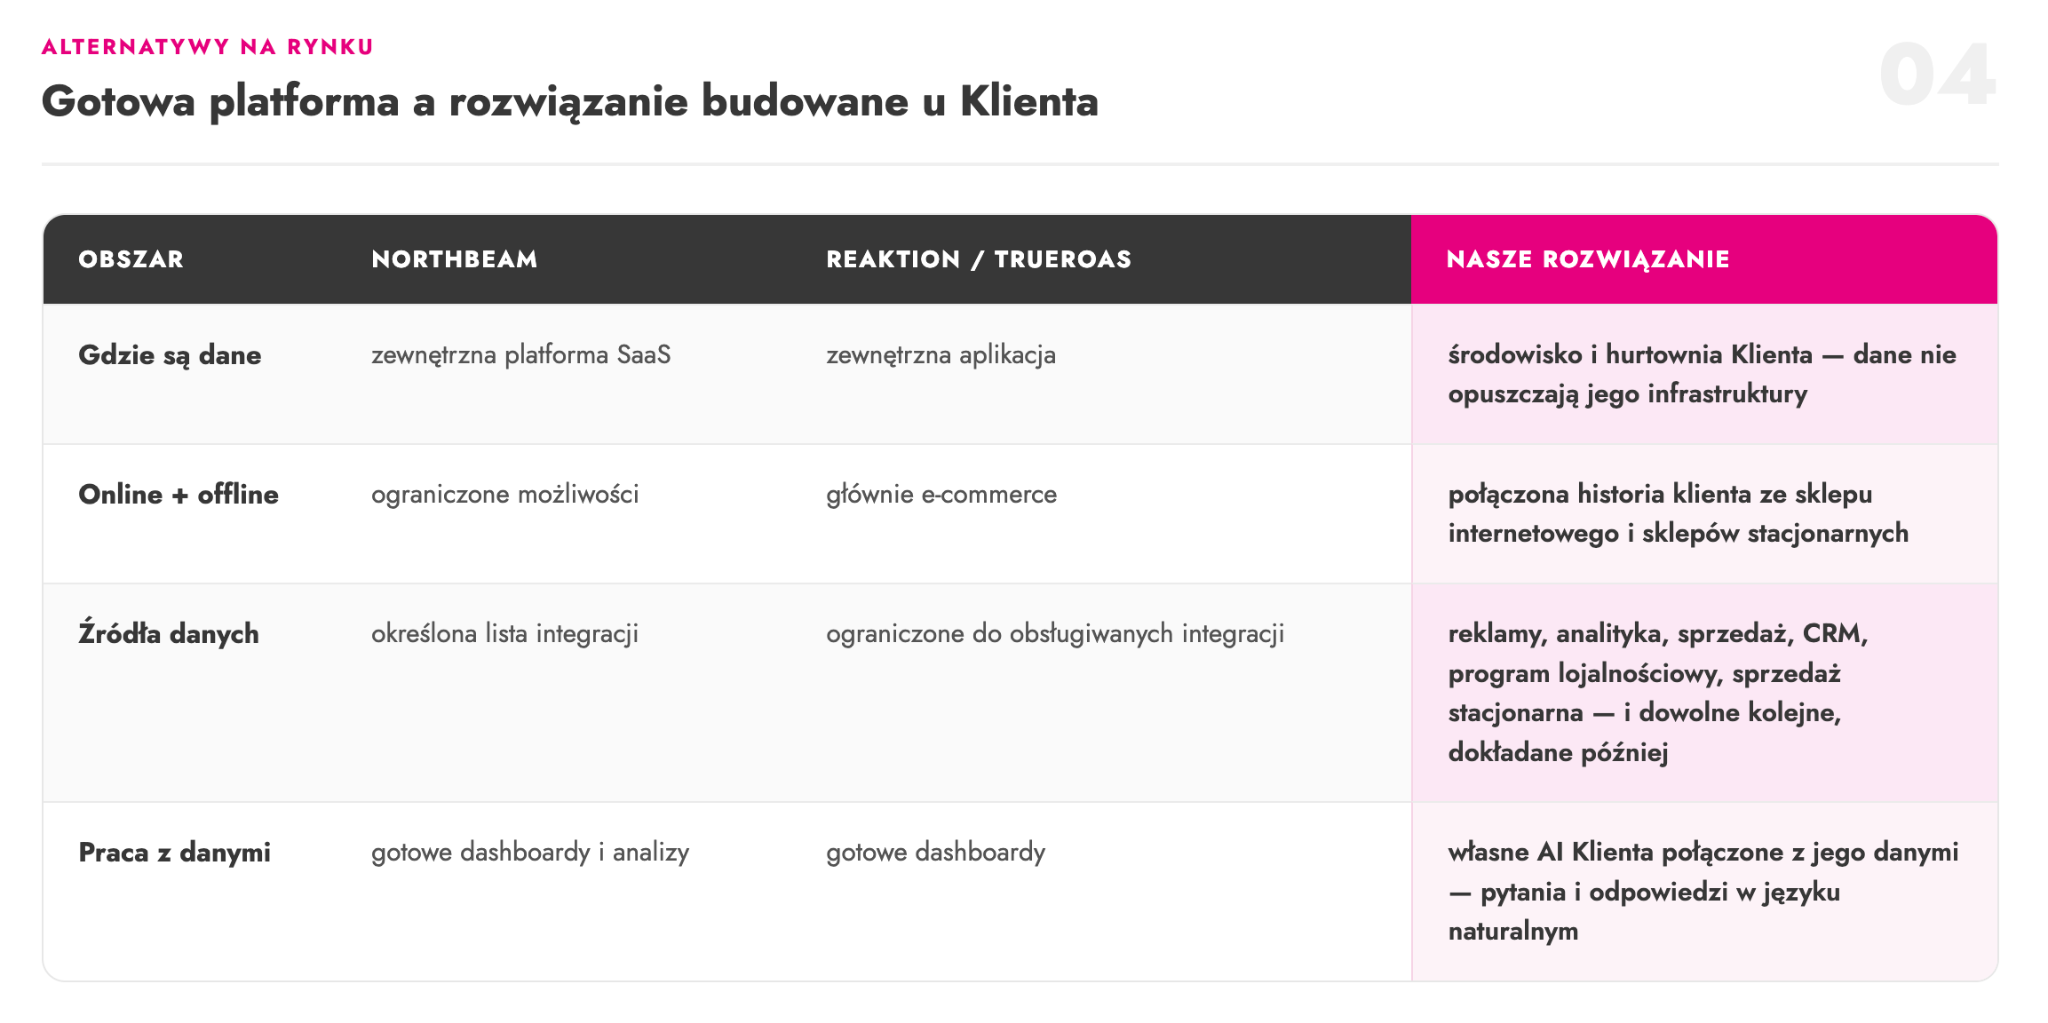
Ready-made applications can be launched faster and, with a simpler e-commerce ecosystem, may be sufficient. Our approach requires greater involvement at the implementation stage, but makes it possible to build a solution around the organisation’s specific data and needs. The scope, and therefore the cost of implementation, is agreed individually.
Key Takeaways
- Discrepancies between tools do not have to mean a measurement error. Each tool records a purchase at a different moment, applies its own conversion attribution rule, and sees only the part of the traffic it can access. For one of our clients, the number of purchases for the same day differed 2.4 times between five systems.
- Incomplete data cost much more than a badly assessed campaign. Decisions about budget, promotions, the offer, and product development are made on scattered numbers, and each of them then rests on a fragment of the picture. The company does not know which activities really contribute to sales, nor who its most valuable customers are, so it loses money twice: on activities that do not sell, and on those that do sell but were judged ineffective.
- Discrepant data are a symptom, not a cause. The source of the problem is looking at the customer through the lens of channels: each tool sees its own slice and reports it in its own way. Anywhere Commerce reverses this perspective: at the centre is one customer and their full history of relationship with the brand, while online and offline channels are only places where this history happens.
- The solution is not another tool, but connecting the data in one place. Our own user identifier set on the server side, passing information about the specific campaign and creative to analytics, and matching these data with sales make it possible to reconstruct the history of one customer instead of several unconnected fragments.
- A connected journey changes the assessment of what really sells. A campaign without a single conversion in its own panel turns out to be the first contact on a journey that ended in a purchase, 21 purchase events in analytics are in reality one order, and a customer worth PLN 498 in online reports leaves PLN 1,852 with the brand when in-store sales are counted.
- Dedicated AI lets you start the analysis from a business question, not from choosing a report. Questions about the most valuable customers, about products that bring in new buyers, or about the impact of campaigns on in-store sales are asked in natural language, even when nobody prepared a dashboard for them beforehand.
- Ready-made platforms and your own data layer answer different needs. Northbeam and cheaper e-commerce applications launch faster and, with a simpler ecosystem, may be enough. However, they work within a closed list of integrations. Our solution, built in the client’s environment, also covers offline sales, CRM and the loyalty programme, and the data stay on the company’s side.
- IAB, “State of Data 2026: The AI-Powered Measurement Transformation”, 2026. IAB – State of Data 2026 ↩︎
- McKinsey & Company, “Rewiring martech from cost center to growth engine”, 2025. McKinsey – Rewiring martech from cost center to growth engine ↩︎
- IAB, “State of Data 2026: The AI-Powered Measurement Transformation”, 2026. IAB – State of Data 2026 ↩︎
- Deloitte, “2025 Retail Industry Outlook”, 2025. Deloitte – 2025 Retail Industry Outlook ↩︎